How A Financial Services Company Optimized their Workplace Thanks to Data Analytics
“Working with Relogix has exceeded our expectations. From placing a purchase order right through to the implementation and training, the team were excellent to work with. Conexus is a fantastic solution which has provided us with all the information we need to plan for the future.” – Workplace Transformation Lead
About the Company
Industry
Financial Services
Company Size
2,000 Employees
Team Size:
5-10
The workplace team at a major financial services company partnered with Relogix to ensure data-informed decision making. The team started work with Relogix in 2021 to capture data to inform their future workplace design, following the uncertainty that came with the COVID-19 pandemic.
As a result, the workplace team has been able to determine office occupancy and utilisation, dwell time of spaces, and the differences between employee intentions and employee behaviours.

Challenge
With multiple offices in the UK and no objective property data available, COVID-19 spun this workplace team into a whirlwind looking for answers about what was coming next. Pre-pandemic, employees were working in a traditional workspace environment with assigned seating, private meeting spaces, and minimal collaboration zones. The workplace team had a good idea of how space was and wasn’t being used, thanks to data previously collected via manual studies, access control systems, and occupancy sensors. However, that data wasn’t granular enough, and wasn’t presented in a way that allowed them to discover important insights. They were missing the ability to view full data stories, in order to inform new ways of working and the future workplace design.
The team identified key areas to a successful transformation journey:
- They needed to collect unbiased occupancy and utilization data on how various workspaces in its offices were being used, while also respecting individual team member privacy.
- They needed to extract key insights to engage in meaningful conversations with business unit leaders.
- They needed to understand how the employees’ intended behaviours compared to their actual behaviour through comparisons between the desk booking data and sensor data.
- With the spotlight on return to office and new ways of working, the team had a need to collate data to drive decision making in relation to sharing ratios, neighbourhood sizes, the types and numbers of spaces as well as number and size of meeting rooms.
Solution
The workplace team partnered with Relogix for its data analytics and insights platform, recognising that while some sensor technology on the market is similar, it’s the analytics which are crucial.
Relogix successfully deployed over 700 state-of-the-art version 5 proprietary desk sensors to measure occupancy, utilization, and dwell time of seats, alongside a desk booking integration and dashboard to capture employee intent vs employee behaviour. Within hours of installing the sensors, the organisation was able to begin accessing the data it needed.
The team chose to measure three main metrics that were most relevant and actionable:
- Occupancy (whether or not there was presence at a seat)
- Utilization (how long the seat was continually in use)
- and finally, through a desk booking integration, data insights were captured regarding employee intent vs employee behaviour.
The data collection is ongoing, and to date has enabled key learnings and decision making. Through segmentation, the data collected assisted in space planning and the design of department neighbourhood zones. The team was able to observe and segment occupancy and utilization data by floor and business unit, providing the level of detail necessary to facilitate discussions with each business unit owner about how their space was being used and the safety protocols in relation to return to office.
The ‘Spaces’ data visualisations informed the workplace team of the peak and average utilization and occupancy, highlighting that Wednesday at 11am was the peak for utilization (381 desks), and each desk used had a dwell time of 18 minutes. This data helped to build psychological safety for employees that there were enough desks available for them to remain social distanced where they chose, as well as the sanitisation of spaces in line with average dwell times being shown within the data.
Data filtering allowed the workplace team to dive into granular data and inform the sizes of the neighbourhood zones for each department. As an example, the team itself utilises 8 seats on average, with a peak of 12 seats taking place on a Friday at 9am.
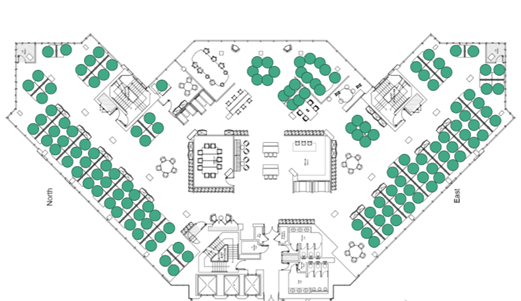
With ‘Live’, the workplace team can view office occupancy in real time, which was operationally helpful during the pandemic when the team were not always in the office themselves due to the restrictions in place. Here is an example of the live view highlighting the spaces which are available:

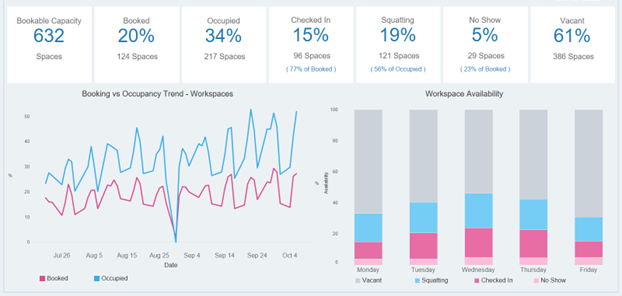
The desk booking technology adoption was initially low, due to a lack of demand on the spaces. As space utilisation increased, employees began to adopt the technology to drive their experience. Below is an example data set comparing employee intent (desk booking) vs employee behaviour (sensor data).

The example data set highlights an occupancy of 34%, but only 20% of spaces were booked, meaning 19% of spaces (121) were subject to squatting. From the spaces booked, on average 5% (29 spaces) were booked but not occupied (no-shows). This data is reviewed on an ongoing basis as the supply and demand of space balances out which will then drive the requirements to book spaces or not.
