Let’s Get Real Episode 33: Humanizing Workplace Data and Managing the Change to Hybrid

Discussions on the Workplace and Corporate Real Estate Podcast

Written by Sandra Panara, Director of Workspace Insights

Key Takeaways & Discussion Points 

  • How do you allocate people and spaces when occupancy and utilization patterns are continually in flux, and peoples’ patterns continue to change?
  • How much did the pandemic actually change typical weekly patterns? Is there even a weekly pattern?
  • What do you do when your data-driven suggestions fall flat in front of the C-suite?
  • How is the role of the team manager changing, and how can we train them to evolve their role?
  • How do quantitative and qualitative data work together to create an accurate story of what’s going on in your workplace?
  • What considerations go into protecting privacy when it comes to gathering and using data? How do privacy requirements affect the granularity of your data?
  • There aren’t necessarily correlations between being high-performing and being in the office it’s all very individualized. 
  • From a change management perspective, how do you communicate effectively with employees about the shifting and evolving ways of working that will affect them? 
  • Are young people going to adapt better (or differently) to hybrid work due to their asynchronous, online education experience during the pandemic? 
  • How can companies be smarter about where they’re spending their money to build real, lasting success and employee well-being? 

Links:

If you liked today’s show, check out more episodes of the Let’s Get Real Podcast! This podcast is available on iTunes, Spotify and Google Podcasts.

Transcript:  

Sandra 

Hey everyone, welcome to Let’s Get Real with Sandra and Friends, a workplace consortium podcast brought to you by Relogix. I’m excited to be sharing conversational musings about current events and how we envision the ever-changing world of work. I’m Sandra Panara, Director of Workplace Insights at Relogix. With 25 years of hands-on experience, I help value engineer global workplace portfolios and employee experiences by aligning workplace analytics with corporate real estate needs.  

Have any questions, comments, or suggestions for future podcasts? Please drop me a line at [email protected] 

Today’s guest is Kevin Sauer, a workplace strategy and technology leader with more than 20 years of experience in building high-performing workplace strategy programs for Fortune 500 companies. Kevin is passionate about understanding the impact of emerging and innovative technologies, people strategies, and space usage on the changing nature of work.  

Kevin’s expertise includes developing Amazon’s workplace intelligence program to uncover new patterns and practices and their impact on the changing workplace. He has also held Workplace Strategy roles at GE, HP, and Microsoft. Kevin’s diverse background in research design and business gives him a unique perspective and valuable insights. We’re thrilled to have Kevin on the show today to share his experiences and knowledge with our listeners.  

Hey, Kevin! Very happy to have you on as a guest today. We’ve interacted in the past on many occasions. Why don’t you tell us a little bit about yourself? 

Kevin 

Thank you for inviting me! I’ve been in workplace strategy for 20+ years now, all with large technology companies and largely focused on global workplace and workplace experience. That’s been the area I’ve focused on, and discovery and research. As you know, things have changed dramatically in the last few years, but a lot of the things we’ve been discussing for those past 20 years are now coming to fruition. And then it’s about what happens next. How do we inform the future and how do we actually understand what we want to do next? 

Sandra 

Great! So, you’ve been on the inside. Even though obviously you’ve been working in workplace strategy, you’ve also been in a corporate real estate team. What are some of the challenges that you’ve faced over the last 3 years from that perspective? 

Kevin 

Part of the biggest challenge is trying to level set on a data-based approach. Initially the things that were gathered were badge data, utilization data, things like that. And inevitably C-suite seems to think that if you’re a high-attending company, that means people are coming in all the time. And getting that first baseline of qualifying what a high-attending company is, it means you’re getting upwards of 80, 82% of people coming in. In my case, Monday through Thursday, pre-pandemic.  

But when you back away and look at it in the course of a year, there’s seasonality, there are different business cycles. So, what you find is that in reality, over the course of the year, average days in the office are really 3 to 4, not 5 days a week. There’s a very small percentage that regularly shows up 5 days a week, and when you factor in vacation and travel and all the things that happen, it makes perfect sense.  

But it’s tough to elevate that to the C-suite level, so they start with the understanding that people are already to a certain degree working away from the office, and that’s continued to trend downwards over the years. That happens to be just a larger correction during the pandemic.  

Sandra 

That’s interesting, about being a high-attending company. Certainly, there’s been a lot of focus on occupancy, or some like to call it attendance, in the workplace. But what about when it comes to planning? You’ve got occupancy, which is just how many people are coming into the office every day versus the actual activities that are occurring in the organization. Were you leaning more towards one versus the other and how did you use the different data points? 

Kevin 

We really focused on the utilization side. What’s being used by how many people for how long. So, sensors are really critical in getting that fine-tuned understanding of what’s happening now, how it’s changing over time. For example, if we see meeting size, particularly in the US, getting smaller, maybe we don’t need lots of large meeting rooms, especially after the pandemic. Most people find it’s more equitable if you do those from home or elsewhere, and you all dial in and have that same kind of setting.  

And when you do go to the office, you’re looking for those smaller spaces where you convene with 2 or 3 people. So we’re trying to understand how often that happens when you run out of space, and comparing that to attendance, occupancy and utilization, to triangulate when and where you need space, how often, and what degree of discomfort are you willing to accept on those peak days, particularly Tuesday through Thursday. Can you average that out so you’re not over-subscribing the space? Or under-subscribing? We’re trying to allocate people as their patterns continue to change.  

Sandra 

You said that people are coming in on average 2 to 3 days a week. That’s been a pattern that existed long before the pandemic. It begs the question of how much really changed during the pandemic, other than formalizing a behaviour that already existed. But when you think about the changes that are required within the office, the fluctuation that’s already happening now on a day-to-day basis because everybody’s looking at the data — how do you plan for that? How much fluctuation did you see on a day-to-day, week-to-week basis, and how do you think about planning for those fluctuations? 

Kevin 

I think the simple answer is it’s still in question whether fluctuation is significantly different than pre-pandemic. You could pretty much count on a weekly cycle of when people would come in. They had their typical weekly patterns. You see many more people that come in sporadically once or twice a month, so there isn’t that week-to-week consistency. So when I was tracking more recently, we were seeing 70 to 80% of the people would attend at least one day a week during the month. And when you step down to a week, you’d see that be about half.  

From an experience perspective, what that means is when you come to the office, you’re not seeing the same people as you did before. You’re seeing a completely different mix and there’s no regularity or pattern to it. So that means your experience is different every day you decide to come in and that helps inform what happens and when you decide to come in next time. It’s challenging to understand what that looks like now.  

The goal is to trend that over time and see whether people start to settle into more of a typical pattern, like a flat line, where you’re seeing things stabilize. It’s going to take a fair bit of time to reform new habits after we’ve all gotten comfortable in the past three years. Now we’ve got to try to think about more choice and more opportunity, and what does that look like. You pair that up with what your team is doing and what others in the office are doing.  

Sandra 

Yes. What about with respect to what you were saying about the fact that you’re essentially bringing new information forward to your executives? Was there an “aha!”? Were they surprised to hear people were only coming in three days a week? What was their reaction? 

Kevin 

I think so, but then it jumps back to, we still really need people back in the office because it’s the best place for them to be. It wasn’t backed by data and research. I mean, there have been a lot of white papers over time that talk about the amount of time you need to get together. And certainly coming out of the pandemic, it’s focused on the idea that there needs to be a purpose. I think that’s been echoed by a lot of companies that would provide a free lunch and they’d see a spike in attendance at noon hour, but that’s it. So certain amenities, and things that were kind of big-ticket items with companies pre-pandemic have gone away. It’s trying to think about it from a management perspective — what do I need to get people into the office, and how do I get them there? And then how does that become a great experience that you want to replicate? 

Sandra 

Yes! 

Kevin 

And executives struggle with that because it’s not a one-size-fits-all. It comes down to every team creating their own strategy around what works best for their team, for the product or service they’re working on. And that’s really hard to control and trust that each managing director is really going to have the company’s best interests at heart versus trying to make sure they don’t lose talent or concerns that we’re losing talent. So the default is, well, if we force a kind of standard and allow some flexibility around that, we’ll get what we want.  

Sandra 

It’s certainly interesting that a lot of companies are doing that, leaving it to the individual team managers to decide, within the parameters of whatever the policy is for flexible work. They’re basically trying to rally their team together. I often wonder, though, obviously if you’re directly managing a team on a day-to-day basis, then that would probably be something you’d participate in to encourage team camaraderie, whether it’s getting together or however it is that you work. But I often wonder, is that really the role that management should be playing? It almost feels like, as of late, we’ve all become autonomous beings. We know who we work with on a day-to-day basis and we make decisions ourselves with respect to what is the most productive use of our time.  

And again, you have to consider the team as well. I’ve heard a lot that it’s almost like the team aspect seems to be a lot more forgiving because there’s that human element to it, versus it’s all about business. What are your thoughts in that regard? 

Kevin 

I agree, and that’s actually one of the areas where HR really stepped up to the plate and said, let’s not focus on individuals, because individuals change and have their own preferences and it may or may not suit the team. The focus is on thinking about how the team works, what enables them best, and the manager is in the position to determine what that really looks like. The next step is to develop some more training around how managers think about what’s really critical about their team coming together, how their work is actually spent. What portions of the day do they need to do that so they can actually think strategically about bringing people together, setting a clear agenda, who’s playing what part, how to prepare, so there’s some kind of build-up and excitement around getting together and getting some good work done. And then we’ll go back and start working on our individual pieces of the project.  

Sandra 

Let’s shift gears a little bit. I know from working with you in the past that there was some stuff happening about a fact-finding design, which is top of mind to a lot of organizations right now as they’re rethinking their space. How do you go about collecting the data? What are the steps you took to get at good data? 

Kevin 

There were a couple of different approaches. First up, just what was commonly available, which is badge data. We actually had security put up badge readers on the way out, so we could get badge in and badge out, so we could get dwell time and rule out some theories about people only coming in for free lunch or to have a meeting, then they go home. We actually found that if people made the trip into the office, they were there for the whole day, there was a fairly large curve on that.  

We also saw younger employees that took the office as their social space, and would stay much longer than your average 8-, 9-hour day. Fewer people would actually show up for just a short period of time 

That was the first step, getting the attendance data to figure out, of those assigned, who’s coming in, where they’re coming to? Are they coming into their assigned area or are they just coming to the closest and most convenient office building? There was a lot of shuffling around that, depending on the type of building where the team is going to be.  

The next step was looking at how the space is being used when they come in. Using a mix of sensors, as well as traditional time utilization studies, walk-arounds so you know what activity is actually happening.  

And then the last piece is doing a bit of surveying to actually understand what’s getting in the way of people coming into the office and about how they actually want to spend their time.  

Once you blend that, there’s an opportunity to go back and have some focus groups to make sure that what we thought the data meant was actually what employees were trying to express in their surveys. It was a good way to at least start to build a story of what’s happening now, and what’s missing. I think there have been some good industry surveys that pull this apart and found that yes, there is a trend towards the most innovative companies and those people wanting to come into the office more of the time, but they’re not there today. There are still barriers, the commute, and other things are getting in the way. There’s an opportunity to start listing out things to work on and continue to measure.  

Sandra 

Were you looking at those data sources individually or were you integrating them together? 

Kevin 

It was a bit of both. The first step was to make sure the data and emotions were correct. You have to get accurate data and then you have to humanize the data. When you’re looking at badge data, did you strip out people that are on maternity leave or long-term care, or maybe just started or just finished their employment during that week, so that you’re looking at the typical employee profile? You need a clear image of what the normalized population is doing. Get that correct, go to the next bucket.  

Utilization. Test, make sure you’re getting the right data, that there are no errors or gaps in what’s being assembled there, and then start putting that together. That’s really the foundational piece.  

The more insightful areas are when you start rolling in some of that talent data. That’s where the People Experience team becomes really important because they can look at a lot deeper elements around DE&I. Are we addressing the needs of all the core demographic of this company? Are there things we need to separate out so it isn’t a one-size-fits-all? Can we start to think about buckets that are more manageable and focused on populations we’re getting at?  

They’re also able to look at employee ZIP code analyses. There was a big shift, pre-pandemic, a lot of employees that were approximate to the campus, so they regularly attended. A lot of dispersion post-pandemic, so when you think about companies that are saying “come back”, well, we have employees that have moved far away. It’s not possible for them to come back, because they’ve gone places where they can afford a lifestyle, where housing is less expensive. Maybe it’s closer to family, and the commute is greater. Then going to work becomes a business trip, and you’re not going to take a business trip every week.  

Sandra 

It’s interesting, I like what you said about humanizing the data, because I think that sums it up really nicely. When you talk to people about data in general, people tend to shy away from it because it’s quantitative, not qualitative. It doesn’t really tell you much about people. But I think, as you just described, when you begin to bring in context, and you’re able to marry together different data sources to understand the attributes of the people behind the data, you learn who they are. Where they live, different things about the job they do, the teams they belong to. There are some interesting things that bubble up when you start to look at data from that point of view.  

Having said that, this doesn’t replace, or it can’t be exclusive of the true qualitative data, which is understanding other things that won’t necessarily come up from looking at numbers or from a sensor or a badge swipe. And you described people moving away — you can see that in a postal code that someone lived here and now they’re 20 miles further away from the office. So the likelihood of them coming in is not that high because they’ve moved further away.  

From an analytics point of view, did you do all the analytics in house with the corporate real estate team, or did you have an external team doing that for you? 

Kevin 

No, from a privacy and compliance perspective. We’re highly sensitive to both real and perceived issues around gathering this type of data. You have good data sources, but when you start to cleanse them and make sure you’re providing privacy, you’re stepping away from the individual and getting at team level. So, you have to take in multiple data sources to then get back to a really tight data set that makes sure you’re not identifying the people in it.  

So, we did all of that in house. We did some external consultation, but we wouldn’t send anything out that even had e-mail aliases attached to it, just to maintain that privacy. So it’s more a consultation about how others are thinking about blending data and looking for different patterns that emerge out of that. That was mostly done with real estate facilities organizations. There was some good partnership with People Experience, and they would start to look at different ways people are using video collaboration and instant messaging and tie that back to talent analytics.  

We found that high-performing employees connect with more people more often. Common sense, but then you start to say ok, is there a correlation between high-performers and more time spent in the office vs home? It falls apart. It’s all over the map, the situations are all different, they’re going to choose the environment that suits them best. But it doesn’t really take away from whether they’re high performing or not.  

Sandra 

That reminds me of an example in previous years. There were people saying that being in the office makes you more productive, so there was a theory going around that if your manager or your team was in the same city, somehow those people were more productive. And it was to the company’s disadvantage if your manager was in one province and the employee was in another. I wondered if that was true, so sure enough, I went in and found that that’s not at all true. It’s all over the place. It’s a very, very personal thing. There’s no correlation to that. You have both instances occur.  

Kevin 

I think the key is trying to find the right attributes to filter on. Different job functions, different teams, and we’re just talking about certain teams. I can think about a marketing advertising team, they often want to be in the office more so they can put things on the board and critique it in real time and move very quickly. We’re finding a lot of software developers want that perfect ergonomic setup. They can do that better at home. They can also control privacy.  

So, once you have a few leaders that say, gee, I really need to know how my people are coming in, and they want a more personal approach — we went above and beyond GDPR rules and said we won’t show you a population of less than 10 because we want the data to be used for good, and not for negative purposes.  

Also, tech companies are growing quickly. Your team dynamics change radically over weeks, months, years. We’re trying to stay above a consistent level of detail so that we can plan and trend. Whereas if you get too granular around different teams or individuals, that’s going to change dramatically. So you’re telling a story that can’t be replicated, potentially.  

Sandra 

I think that’s true. The granularity certainly shows you fluctuations and just how volatile the use of space is, and how it changes. I’m in the process of finalizing our next benchmarking report, which is coming out later this week. Looking back, that was one of the “aha”s for me in particular. If you’re trending data on a weekly, monthly, quarterly, or even annual basis, it sort of shows you directionally where it’s going, but then you don’t plan on weekly or monthly values, because there are missed insights that you won’t get at that level. You actually have to go down to the lowest level to understand what’s happening. How often is that kind of activity occurring? So that allows you to quantify how big of a problem certain aspects of what’s occurring in the office actually are. You have that ability to zoom in and zoom out, as we say in our organization, to fully understand the whole spectrum of behaviours within the organization.  

Once you understand that, you can start planning in either direction. But then how do we deal with these instances or these things that are a part of our business? Because as you mentioned earlier, you’re trending data over time, so you can see and quantify just how often these become issues. But from a business unit perspective, or even just from a general business point of view, when you’re looking to transition to a more flexible, more modern sort of workplace — I don’t know if you were already in a shared environment before the pandemic? 

Kevin 

It was a mix. The European teams were about 80% agile shared seating. Asia Pacific was ramping up pretty rapidly around that. US always kind of lags behind. It’s typically only the sales organizations that are gaining more of a shared environment, and have expressed the need and interest for a variety of spaces. But one of the things we were able to find going into the pandemic, we started doing a lot of focus groups where employees could get their concerns or needs met. And we actually brought in an architect to lay out a floor plan with 3D objects, and asked each team, what do you need? They started adding more white boards and more spaces, each time chipping away at the number of desks. The footprint doesn’t change, but you’ve reduced your desks. What can we do about that at that point? It was actually the teams that said, I think we can share, because if we have the flexibility of having our own desk at home, all we really need is to make sure there’s an individual space.  

But our focus is on convenient collaboration, for technical teams we wouldn’t typically have focused on in the past. We’re now saying, yes, they could actually share.  

Sandra 

That’s pretty cool. I like that concept too. You give the teams the ability to basically create their workspace, where they come to the conclusion themselves that they don’t really need individual workspaces that they sort of fought for before. So they come to the understanding that they don’t really need that kind of space, and it becomes easier for them to give it up.  

But that leads to the next question: when you’re going through change management, because this is a huge change, and I don’t know if there’s ever going to be an end to it, how do you manage that change from a workforce perspective? I think about a company where I worked where they tracked workstyles in an SAP. You were designated a workstyle based on the frequency with which you came to the office. It didn’t mean that if you were considered remote, you weren’t allowed in the office. But it allowed for different considerations and being able to track it in a system like SAP.  

Did your company do the same thing, or what were some of the things you did to track or manage it from a workforce perspective? 

Kevin 

I’ll touch on employee profiles first. Back many years ago, when I first went out and did a full world view of a company and tried to break it down into work styles, worked with HR to get all the different job families broken down into seven different job families and profiles. We thought we were really making great progress, but when we started sharing with teams, arguments would break out, like I’m not really an A6, I’m kind of an A7 depending on which phase of the project I’m in, etc. All of the conversation was whether they are in the right profile, and I quickly realized that it’s difficult to describe that to employees. So we just moved to XY coordinates and did a four square and said OK, it’s a scatter plot, you’re going to fall more into one quadrant than another. It doesn’t mean that you’re that profile, but your tendency is more towards that. Much easier to describe and talk them through that.  

We can pick on sales and marketing. You’re highly externally mobile when you come in to the office. You’re also internally mobile. They’re much more suited to having a variety of spaces, having mobile technology, and we can help with the process of transitioning to that kind of environment.  

And then how do you relay this information, and prepare spoon-sized pieces of info? We could create a wiki, do some fun animated videos so they can consume it all in bites over time. And if there are things that aren’t working well, you can reinforce those in a fun, playful way and get feedback as to what’s working, and what gaps there are. So, each person has to kind of follow their own journey in a new way of working.  

Sandra 

I like the idea of the scatterplot matrix. It takes me back to my early days of workplace strategy. I remember a matrix where you have the low and high collaborator. It’s a spectrum. And then on the other spectrum, it was dependency on the office. So based on the frequency that you came into the office, and the percentage of time that you were actually collaborating when you were in the office. Those were the two factors for many organizations back in 2000, which really dictated what your work style was. You could be in the office every day, not collaborating. You are considered what we’d call an anchor, and you basically get assigned a desk. Those would be your administrative assistants, people that aren’t really participating in meetings like other people.  

Then on the other end you’ve got people who are 100% remote. They never come into the office, and they’re high or low collaborators. Those would often be offshore, and that doesn’t mean that they never collaborate, but the likelihood of them collaborating is slim to nil. There were decisions around the technology required to support those types of workers.  

I love the point you made about people struggling with categorization. They get hung-up or fixated on the grouping that you give them, whereas it’s really just a generalization from a planning perspective so we know how to allocate space to support the needs of various people. It was always interesting that the middle ground between mobile and out of the office, who came in from time to time, rarely sat at their desk. They were constantly moving around and working with different teams. That usually accounted for 50 to 60% of the workforce. You rarely had people coming in and sitting at their desks 5 days a week, 8 hours a day, and then you had remotes that came in maybe once a quarter, once a year. We don’t really have to worry about those people a lot.  

But the middle group or category of mobile workers, that’s where you get all the variation. You’ve got people that are highly mobile internally vs externally, and their needs are very different in terms of how they interact with each other. Add the fact that now you’ve got hybrid on top of that, because now there are people that would have come in to the office every day but are now working from home and relying more on technology. It just complicates things that much more.  

Sandra 

For the matrix or quadrants idea, what should be the comparatives in your opinion? Should it still be based on the frequency of attendance or the level of collaboration? That’s what organizations are saying is the reason why people need to come back to the office, to collaborate. Do you think that’s still relevant, or do you think there’s something else that might be more fitting based on what’s happening right now? 

Kevin 

I think it’s more complicated that you’ve got a wider range of teams. From the pandemic, we’re getting more remote teams. You’ll find that there’s certain talent elsewhere in the world or you need to have fast sprints even for some of our data analytics. All the data went through Europe first, so they can transform it according to GDRP. They ship it to us, we start to work on it. We could ship it to APAC, and within 24 hours, we can come up with some fantastic results relying on this. Suddenly teams are now virtual by nature of either time zone or just hiring talent where they’re at.  

So, it gets much more challenging to think about what it means to be in the office. Are you really going to get everyone in the office, even pre-pandemic? If you think about your big team summits? Not everyone could come. There’s always someone with a wedding or got sick last minute. You get 80% of the group that would come together, with a few virtual participants. Now that virtual participation has grown. It’s almost a default that you have to assume that at least 1/3 of your team is probably going to be virtual. So how do you include them? 

I think at least during the pandemic, we’ve all had the opportunity to be the person on the end of the call that didn’t have a great experience. I worked for 10 years from home, and was always trying to figure out ways I could insert myself into the conference room and actually get a word in through the phone when everyone else is in person. It was incredibly hard to do, and people didn’t have the etiquette to stop and say, did we get input from everyone in the meeting, including those who are virtual? Now, I think, there’s much more ability and thought around that. And of course, now we’re using video, so you can see your raised hand and signify that you’re participating and want to comment. So it releases some of that pressure on trying to get everyone to be in person.  

Sandra 

I think that’s a really good point. That’s one of the things I struggle with, when organizations are pushing for people to come back to the office because of collaboration and innovation. It feels like it’s very narrow-minded, because you’ve got globalization of work. You’ve got teams literally scattered, especially if you’re a global company, you’re going to have teams scattered all over the globe.  

I’ve worked in a similar situation where work goes around the globe. There’s a cool factor to that where something would have taken 2 weeks to do, but you can literally do it in 24 hours or 36 hours just by going through different time zones. The velocity of work getting done is actually pretty cool, when you basically just pass the baton on to the next team and they continue the work. And then it comes back to you next morning, ready to go. We can move a lot faster.  

The old process of everyone being in office, meaning just the local people, because there’s always going to be that virtual element — it’s really interesting as we talk about the fact that the world of work has changed long before the pandemic. I think with the advent of technology, just how much work has changed has come in to focus. And for us to say, why am I going in to the office every day, because I can do this from home. I don’t need to physically be in the office, but there’s a push and nudge to go back to the office because of collaboration, innovation and team camaraderie.  

Kevin 

I think one other point is that I have three children that were between high school and college during the pandemic, so they all had to shift to different learning styles. A lot of asynchronous learning. When that population starts into the workforce, they’ve had to grow up in that environment where you get team projects done without getting together. You have to be asynchronous. I think education is trying to go through a lot of that pollution as well, which means the future workforce is going to come in with a different approach. How do we absorb that? Part of that is a bit of push and pull — a bit like a marriage. When you have a good marriage, everyone gives and takes and you find the best middle ground for each party.  

So thinking about young employees coming in, they want to have mentorship and engagement, and the best people to do that are tenured and most likely to be working from home.  

I saw that over the internship season, where we had all these interns come together looking for their managers who weren’t there. They found the one fully agile building and said, we’ll all congregate here. They started coming together and fully activating the space. Then as intern season moved away and some came on as full-time employees, they continue those relationships. They continue to sit together even though they came from different teams. Because they’re forming their own community.  

I think that’s really fascinating, and the question is, is that a new community, a new culture, or is that culture aligned to the existing company culture? Or is it divergent, and potentially going to create some rift? Are they creating a culture that didn’t exist before and may not align with that of their mentors? 

Sandra 

Just last night I came across a quote on Facebook that made me pause for thought, as we’ve been talking about CEOs mandating people back. The quote said, “I’m so happy, I had a childhood before technology took over”. It made me think about how different the childhood experience is today. And it has been different for a number of years, since technology came to the forefront. Kids are born with technology in their hands. Yet, when you think about work, or even education, it’s kind of like taking a step back. For your early years, is it good or bad is a whole separate discussion. But in my day, we didn’t even have access to television. We had one, but nobody watched it. Kids were outside playing until midnight. And it wasn’t a big deal. You don’t see that much anymore. Kids are playing video games, and the whole childhood experience of being outside is not the same as it was when we were growing up. They’re so absorbed in the technology that they now have access to. 

It made me wonder when you were talking about internships, is that community of culture-building to fill that void that was created by the lack of enablers within the organization? Because organizations are still pushing for old traditional ways of work. I don’t know if you’ve experienced this, where you come into an office and it has all the newest gadgets, so you’re running on the latest version of everything, you’ve got all the fancy tools. And then you go to another company who’s 20 years behind in their technology enablement. That’s a huge drain on productivity.  

It makes you wonder, is that the same sort of thing that’s happening, where people are saying you need to be in the office for mentorship? It’s kind of like, but that’s why that technology is there. Kids are going to school and handing in papers digitally. There’s a lot of digital interaction going on already where they’re from, right through to university. And then in the working world, it’s 100% face to face. Because that’s how you build relationships, that’s how you collaborate, and so on and so forth. But it feels like there’s a bit of a disconnect there.  

Kevin 

There is, but I think there’s value in bringing those two worlds together. As much as technology changes, it’s typical that the kids are going to be most involved in what’s new and trending. So as a kind of more tenured employee, if you come in, you’re going to be getting that mentorship on how to use that new technology. Or getting tips and tricks on how to be more efficient or catch up with the latest products. And then in turn, you can talk through things like work etiquette, what does it mean to work, how do you balance that, how do you engage with people?   

I think there’s been a bit of a shift in the tech side of what they focus on. For a long time, you looked at all the top schools, like MIT, to get your top-tier talent. But when you dig into the education behind that, we find it’s often highly competitive, you’re looking to be the best individual, but then you step into the office, you can’t be the best individual. You have to be the best team player if you’re going to succeed.  

And that’s a really tough transition. So even some of our organizations are starting to not look at those schools as much, because there’s too much competition driving up the price. And we spend a lot of time trying to attract that talent, whereas ultimately, a lot of the younger employees actually didn’t come from those schools, had much stronger skillsets, and were likely to stick around longer. You had better employees if you stepped down a tier. So they started focusing on the traits and skills that provide the most value to the company, forgetting about where they came from, and figured out how to attract and train that type of person. A lot of shifting in thought and shifting in what that transition is like.  

Sandra 

That’s really fascinating! Another thing I’m thinking of as we’ve been talking through this, is about past experiences and bringing information forward when you suddenly have data at your fingertips. I’m a data nerd, I’ll be the first to admit. It’s exciting! You get to understand things you could never have imagined before. You get to be super excited about it. And you think, what could we do with this data, whether you’re trying to solve a problem or add some context to helping the organization with respect to the directions they might want to take. What’s fascinating to me though is how a lot of the times, it’s a huge let down. You bring that information forward and they’re like, yeah, that’s nice. And it falls flat. Have you experienced that, and why do you think it happens? 

Kevin 

It definitely happens. Certainly, early in the pandemic we were getting ready for that first policy announcement on what the strategy would be, from a corporate perspective. Preparing for that it’s like OK, let’s take a look at 2019. I had the team run through and crunch a full year of 2019 data, and look at by region, by leader, by day of the week, that sort of thing. As we talked about, 3 to 4 days pre-pandemic was the regular attendance, and it was Monday through Thursday, and didn’t evolve. The original quote was hey, we’re a high-attendance culture, so we’re going back full time.  

But that’s not going to land, and it didn’t. So we came back and said, can we do 2 days a week from home? To replicate what people are already doing, but just put some structure on it? But things have changed, so we had to go through a learning process, and think about where there’s starting to be traction now that the pendulum is swinging back, there are slowdowns, there are layoffs. Therefore, people will do what we say, missing the fact that with this dispersion, there are significant numbers that have either a significant commute, or are too far to physically commute, so they can’t return, or that return is going to make or break the situation.   

And is it worth it to go that route, to disrupt morale? You’re going to ultimately take away from productivity, because now you’re getting people in a car in stressful traffic. So they show up, not ready to work, but ready to decompress from the commute. Then they’ve got to work and focus on when they need to leave so they can get home to be home for dinner or for evening activities. It puts a lot more strain on the workforce.  

Sandra 

Yes, those are all valid points, especially when it comes to change management. It comes down to yes, the executive team might want the organization to do a certain thing, whether it’s supported by data or not. This is what they want to do, and then you wait around and see if people comply, which we’ve seen is not actually happening.  

And there’s still all kinds of speculation about the economy continuing to go south. And the idea is it’s going to put companies in a position where they believe people are going to come back to the office because they can mandate that even more so, but I wonder about that.  

Having gone through the pandemic, and this is my own personal opinion, I think that people came to the realization that the lifestyle they live is dependent on their employability. Or the fact that the company they work for determines that for them. And it’s a scary thing. When you have no control over that, like we all experienced during the pandemic, you start to get creative, start to think about doing something that won’t put you in that predicament going forward. So, I don’t think the control that organizations had before is the same now. I think people will just say OK, I’m an experienced person, I’ll just go at it on my own. I’ve got friends, and friends of friends who have done that — they’ve lost their jobs and just gone on to work as a consultant, they pick and choose their customers, work the hours they want to work, and make enough to pay the bills. It’s no longer about climbing the corporate ladder or striving for success, however you define that. 

It’s interesting when you think about the idea of making work human — it’s comical to me, because what was it before? Why was there this dissociation with being human in the workplace? It’s the idea that work isn’t in the business of caring about peoples’ lifestyles or well-being or whatever, and then now it is? You’d be foolish not to think about all of the elements that impact peoples’ lives day-to-day, even though you spend a tonne of time working. There’s still an element of why do we even exist in the first place? To work? 

Kevin 

I think that’s it. People had a chance to realize that one, life can be short, and it’s worth taking risks. And what are we doing this for, are we living to work or working to live? We’re also seeing family dynamics change and shift. I live in the Seattle market, and prices are going up. It’s getting more crowded, and for a while I had people say, I’m going to quit, move to Nashville, or other places in the country that sound great to be in right now. Very quickly, they settled in. Cost of living was better, it’s a smaller location, they were able to find work and are happy with the shift. So think about that movement, there is more of a focus on trying to find that work-life balance, or really, work-life integration, and what that means at an individual level.  

The other thing that I think comes out of it, which unfortunately is a qualitative data piece that often gets missed, is the opportunities that show up through some of these employees’ stories. The best one I came across as we were surveying to find out how it worked was about a young mother in South Africa. She and many other young mothers had moved away from villages into the city so they could get higher paying jobs and send money back to support their families. When the pandemic hit, they were able to move back with family, continue their jobs, and see their families full-time. They said wow, if we could continue doing this, I now have money to pay for a house to put this family in, they’re with their family, much happier, and now have a better bond with the company because they allowed me to have this more fulfilling life. If those are the few mothers that made that shift, there’s probably a great talent pool that wasn’t able to or wasn’t willing to make the sacrifice. Why wouldn’t you want to enable that?  

And particularly with me, we’re launching satellites every day. Internet will soon be ubiquitous, so people can truly get access to the Internet everywhere. You can tap amazing talent wherever they are.  

Sandra 

That’s probably the best comment in all of this. As you think about the role real estate has played, and take a step back and look at the money that’s been spent to support a way of working — people have voted with their feet every day. It becomes a question of forcing the issue. I don’t know, you have to take a step back and think, how can we improve the lives of our employees and basically be more selective about how we spend the money that you would have spent on real estate to keep your workforce happy. Because if your employees are happy, they’re going to be more productive, you’re more productive, you generate more revenue, and everybody wins in the end. 

I think that’s really key here, it’s not about whether the office is dead or not, it’s about there being a smarter way for companies to think about the role that real estate plays. That’s not to say to eliminate all your real estate, there’s still a need for it to some degree, but we don’t need to be gluttons like we have been, where we never even looked at it because it was just a necessary evil. Now there are so many issues in society, where companies can be smarter about how they choose to spend their money to serve some of these programs, like you mentioned EI, sustainability, community-building. There are all kinds of things that companies can do where they can still elevate their brand, but just do it in a different kind of way. It’s not about slapping a logo on a building, it’s by actually participating in society and doing it in a way that your employees become ambassadors or your brand. I don’t think there’s any better way for companies to be successful going forward. 

Kevin 

Probably the best example of that is my first workplace project in the Netherlands. It took a while to get off the ground, but it really changed the sales office, so leadership rethought how they engage with customers, went through a full transformation, started listening, and actually realized they had a much better partnership and higher sales in a down economy. And then because it was such a successful transformation, the government said hey, can you help us around change management at a country level? 

So you’re starting to re-think how this all comes together. The company starts to create that purpose within a company because most people aren’t going for a paycheck. They’re going for a meaningful role that gives them purpose and meaning and has a paycheck. If you can blend it all together, you’re building a strong tie with your employee base.  

Sandra 

Totally agree, Kevin. I can’t believe the hour is already up! This has been a lot of fun, thank you for your time today and for being a guest on our show.  

Kevin 

Thank you so much Sandra, great to see you again! 

Sandra 

Thank you!

About the Author

Sandra Panara, Director of Workspace Insights

Sandra has both a deep and wide understanding of Corporate Real Estate and Technology. With over 25 years hands-on experience she is able to apply non-traditional approaches to extract deep learning from the most unsuspecting places in order to drive strategy. She has developed an appreciation for always challenging the status quo to provoke and encourage new ways of thinking that drive continuous improvement and innovation. Sandra believes square pegs can fit into round holes and that the real ‘misfits’ are those environments that fail to adapt. Her expertise ranges broadly from CRE Portfolio Research, Analytics & Insights, Workforce Planning, Space & Occupancy Planning & Workplace Strategy.

How Market Shifts, Energy Goals and More Capable Sensors Are Shaping the Future of Workspaces

Written by Jeff Bennett, President and COO

The future of workplace environments will be rooted in smart choices that allow people to work happily, easily, and more efficiently, driven by real-time data insights. Instead of employees questioning whether they should come into the office today, they’ll be inspired by the benefits the workplace offers and the defined sense of purpose that uniquely defines the experience. 

Critical to defining this future is a full understanding of how, why, and when people work and what they do when they gather in one location. This knowledge is especially crucial to corporate real estate, facilities managers, and workplace leaders, who need to know how their buildings are operating and being used while ensuring their workers and occupants are well-tended.  

To accomplish this goal, the entire smart workplace and building information chain will increasingly depend on accurate, timely, and secure data sourced from diverse types of occupancy sensors and inputs. The resulting insights will inform and define a variety of trends – ranging from market shifts to evolving workspace preferences, integrated sensors, and the ways in which companies are advancing their goals of sustainability and carbon neutrality. 

Occupancy data is essential to any energy efficiency strategy 

Businesses are increasingly pressured to evaluate and adjust their property portfolios amid economic and environmental concerns. At the same time, carbon-neutral goals are becoming increasingly important to businesses as both regulators and consumers seek sustainability. 

New York City’s Climate Mobilization Act is also encouraging businesses to take carbon neutrality more seriously, with Local Law 97 requiring all buildings larger than 25,000 square feet to “meet ambitious carbon reduction targets.” In order to keep up with regulations, achieve energy savings and remain compliant, businesses will need to determine when, where and to what degree office spaces are being occupied. The results are essential in any plan to optimally manage energy efficiency. 

Workplace patterns, and subsequently workspace usage, remain less predictable than in the past. Consequently, businesses that rely on traditional rule-based models will yield less effective results versus organizations that embrace and utilize real-time monitoring and automated operations. Sensor technology can help businesses achieve their goals by capturing the pulse of day-to-day building functions, which aids in critical decisions and provides seamless occupant experiences. 

Businesses need to build workspaces that foster productivity 

For all the hype surrounding the future of work, many organizations have maintained full or partially- remote working policies, which are largely preferred by employees. But as the Great Resignation continues, the battle for talent is driving an interest in digital experiences – and the fight for tenants is doing the same. 

Digital experiences may include touchless entry points and other ways to interact without making physical contact. On the employer side, organizations need more targeted information to navigate volatile return-to-office trends and to design their ideal future work environments.  

However, the ideal work environment is not a one-size-fits-all creation. Businesses need the right workplace technology, and the resulting occupancy data insights, to best determine their employees’ workplace preferences. That information is also vital in helping organizations determine how to create workspaces that foster productivity and meet employees’ changing needs, and where to prioritize their investments in workspaces, experiences and culture benefits based in insights rooted in actual behaviors. 

Achieve greater productivity and energy efficiency 

As workplace arrangements continue to evolve, organization and employee experiences are taking center stage. Businesses have come to recognize the need to design environments that foster greater employee productivity and satisfaction, while also carving out the essential purpose – disassociated from the physical place – that the office holds in their lives. 

Businesses are quickly realizing that, by relying on the latest sensor technology, they can better analyze occupant engagement and linger time within discrete spaces. Advances in sensor technology also make it possible to collect granular data on preferences for furniture type and placement, allowing for maximum customization – and supreme occupant appeal – within workspaces. The result is increased employee satisfaction, heightened productivity, and improved energy efficiency. 

About the Author

Jeff Bennett, President and COO

Jeff is an accomplished executive leader with a 20-year track record for delivering repeatable and scaleable methodologies across all departments of an organization so that ambitious corporate objectives are attainable and highly strategic business challenges can be solved.  As the Chief Operating Officer at Relogix, Jeff is accountable for ensuring that all aspects of the business are aligned and structured to achieve market success by ensuring the customer is at the center of everything we do.  Jeff is also an executive mentor with Invest Ottawa and coaches leaders in many startup technology companies. Prior to Relogix, Jeff was the Founder and Executive Consultant at ServiceVantage Corporation where for more than 13 years, he worked with the executive teams of over 40 companies to develop, improve and scale their operations and customer experience groups. Jeff has held senior executive positions for companies such as Marketwired, 360Incentives, and Phreesia.

How To Kick Start The Best Workplace Strategy Using Space Utilization Data

Written by Sandra Panara, Director of Workspace Insights

Your lack of space utilization data is holding you hostage. Your workplace remains at a standstill, unable to move forward with any changes to the office that will be needed during and after the return to office (RTO) period.

You need good data to guide key workplace decisions. But without a critical mass of employees coming back to the office, traditional data sources aren’t that useful anymore. The kind of space utilization data you need today can’t be captured by those pre-pandemic methods: employee surveys, desk booking, security access badge data, etc. Even historical data, benchmarking data, and other baseline data has become irrelevant for guiding fundamental changes in the workplace going forward.

Workplace change is on the horizon—restrictions that kept us at home are relaxing, and everyone wants to get on with life. But work life is going to look very different in 2022 in comparison to 2019. Why and where people go to the office will be driven by new factors, like managing personal health and well-being.

We all know change can be an expensive proposition—but it doesn’t have to be, if we can dig in and really understand exactly what changes are necessary, and why.

What is Space Utilization Data?

To get a grasp on where to go from here, we have to pin down the concept of space utilization.

what is space utilization data defintion

In Corporate Real Estate (CRE), space utilization data measures how efficiently office space is used by employees. So, what do we mean by “space”? Is it the building, the floor, an area, a room, a specific seat? Depending on what you’re interested in measuring, it could mean any of these—and the way you capture and calculate it will vary, too. While some companies are interested in building or floor-level occupancy, which they can get from security access data, others are interested in areas, rooms, or even seat-level occupancy. This requires other methods for capturing the data to deliver the insights.

Before sensor technology was available, building (and floor) level occupancy was captured by security badge data. The terms “occupancy” and “space utilization” both meant the total occupants divided by total seat count. So, if you had 600 seats and 450 occupants, you’d have 75% space utilization.

If companies wanted to go deeper and get at area, room, or even seat-level occupancy, they needed a site observation study which involved taking manual attendance at regular intervals per day, usually over 2 or 3 weeks. Then, it’d be analyzed to produce a snapshot of how different spaces on the floors were being used over time. Space utilization data derived this way wasn’t totally accurate, but it was the best we could do at the time.

Sensors changed all that. The definition of occupancy didn’t change, but “space utilization” now means measuring how much time people spend in particular spaces. The badge data still provides information on attendance counts and the distribution of people among floors, and sensors enable further analysis, by providing more details about where people go when they’re on the floor.

space utilization data charts with and without sensors

Understanding space utilization at this level is a more reliable measure—sensors can capture how many people are in the spaces at precisely the same time.. Knowing all this provides a level of insight you need to begin to inform potential changes.

Back to the Top

Starting Strong: Learning Occupants’ Behaviours

To understand what needs to change in the office, we first need to understand our employees’ behaviours. With this, we can start to make decisions that best align the office design (and furniture) with how people prefer to work. This way, we can provide more of what works, and reduce or eliminate what doesn’t.

To start, how do we know where to focus first? We can all agree it’s far too early to use this data to decide on things like getting rid of square footage or re-designing the entire workplace. Space optimization and square foot reduction strategies that yield huge cost savings are important—but aren’t the right place to start. The priority now is to use the data we have to encourage, support, and understand employee preferences as full-on RTO activities get underway.

The priority now is to use the data we have to encourage, support, and understand employee preferences as full-on RTO activities get underway.

The first underlying goal is to understand what sort of spaces work best, so we can work into our plans changes that might provide more spaces like it, and change spaces that are no longer necessary or preferred.

Back to the Top

Out with the Old, in with the New: Sensors and People Counting

Early baselining and trending will be key in identifying what people want and what changes you may need to make. For example, you may want to understand what the new capacity planning requirements are, or what design changes and/or furniture changes are on the horizon. Doing this without the right data can be costly and disastrous.

Sensors and people-counting technologies are your best option for accessing early “micro” signals that illustrate the changes in how people are using the office since the pandemic started. This holds true, even if the data comes from just those few people who do return in the early days of RTO. Data captured from Relogix sensor technology can give you a granularity of detail that you can’t get from traditional data sources.

It’s also worth noting that one sensor technology can’t do it all, either. Different space types may require different sensor types to best capture the utilization of the space.

Ultimately, sensor data is the way forward. You need access to good data, and fast, to understand where people go when they’re in the office. There’s no better time than now to enable this kind of learning and get accurate insights in real time.

In the example below, we’ve extracted some micro-data from our own database of clients to show the value of sensor technology in making decisions about the workplace.

usa weekly occupancy trends open collaboration and meeting rooms

In this Weekly Occupancy Trending graph, we can see the output generated from sensors in a sampling of meeting rooms and open collaboration spaces. It shows us that the demand for meeting rooms has stayed fairly constant since the beginning of February, while demand for open collaboration spaces seems to be on the rise. Even though this graph only shows five weeks of space utilization data, we can already start to think of reasons for these trends. For example, people might have a preference for open collaboration spaces to have better control over their personal space, to maintain proper physical distancing.

The emerging trend here doesn’t necessarily mean that the meetings that are happening are less structured, i.e. more spontaneous than scheduled ones (although an integration with your room booking and calendar data can surely validate this!). Instead, these early trending insights serve to kick-start your design process. This behavioural data can help you qualify and quantify what parts of meeting and collaboration spaces might need changing, re-purposing, or re-designing, so your workplace can better align with what people need.

Back to the Top

Getting into the Nitty Gritty: Using Sensor Data to its Fullest

Space utilization trending data can be easily extracted using the right sensor CRE technology tool. It’s important to remember that data observations over short periods of time are highly volatile—when data is aggregated to a weekly or monthly view instead, you can start to see steadier, more reliable trending directions. Extremely granular data may not be enough to action anything right now, but it can still give us an idea of where we’re starting, and where the workplace might need to go in the future.

In the graph below, we’ve used the same data shown in the previous graph, but have expanded the month of February, to see what’s happening day-to-day. As you can see, it’s harder to see a trending direction for these two isolated space types.

usa daily occupancy trends open collaboration and meeting rooms

But this data still provides immense value. For example, the daily view shown above tells us just how much the demand for space swings from one day to the next. We can see that meeting room space use has generally trended higher on a daily basis, when compared to open collaboration spaces. We can even see peak use occurrences for both space types, which gets lost in the rolled-up monthly aggregate view shown previously.

Seeing the same trends, but at this granular level, might change the way you approach your space planning objectives. More importantly, it highlights potential challenges you may have in effectively managing space availability and capacity, if space reduction is the ultimate goal.

Showing up at the office during the RTO period and not having a space to work that feels safe won’t go over well—but this granular data can help you dial-up your space availability to support demand, to make for a positive employee experience during this crucial time.

Back to the Top

Using What You Have—Now

Having the right sensor technologies in place will give you access to the detailed data you need now to see new and emerging space use demands. Trending has been a confidence-builder in the past, and it’s no different now. The sooner you start trending the RTO activities, the easier it will be to determine where to focus your attention. Get ahead of what’s changing, how those changes are shifting workspace demands, and what this means compared to your current supply—after which you can start to plan adjustments accordingly.

Understanding this early on will guide key planning approaches that will eventually support factual decision making. Decisions based on reliable and factual data are more readily accepted and met with less resistance by those they effect. Now is the perfect time to use sensor data to inform and implement changes that are ultimately in the best interests of those using the workspace.

About the Author

Sandra Panara, Director of Workspace Insights

Sandra has both a deep and wide understanding of Corporate Real Estate and Technology. With over 25 years hands-on experience she is able to apply non-traditional approaches to extract deep learning from the most unsuspecting places in order to drive strategy. She has developed an appreciation for always challenging the status quo to provoke and encourage new ways of thinking that drive continuous improvement and innovation. Sandra believes square pegs can fit into round holes and that the real ‘misfits’ are those environments that fail to adapt. Her expertise ranges broadly from CRE Portfolio Research, Analytics & Insights, Workforce Planning, Space & Occupancy Planning & Workplace Strategy.

How to Use Your Booking Data to Build a Better Strategy

Written by Simone Fenton-Jarvis, Workplace Consultancy Director

Level Up Your Data with Conexus

In the world of work today, we’re living with a whole host of variables that complicate the landscape: uncertainty surrounding today’s world, data siloes and out-of-date data, the absence of a single source of truth, and the evolving needs and desires of employees, and more. In this turbulent environment, organisations are continuing to deliberate over what to do next.

Above all, data-driven decision making is crucial. The problem isn’t the amount of workplace data that exists now or will exist in the future—the problem is ensuring the transparency of the data, to the right people, at the right time, in the right way. No person managing space has the time and mental bandwidth to number crunch and analyse multiple data sources, using resource-heavy and cumbersome tools. They want and need trusted answers and genuine insights, ready and waiting.

This is where Conexus fits in.

The Conexus platform ingests and integrates multiple data sets, layering information to produce dynamic, trusted, and fast-to-the-finger data. Sources could include:

  • Occupancy sensors
  • Space booking systems
  • IWMS
  • HRIS
  • Badging
  • Surveys
  • WIFI

Make Your Data Work For You: Space Booking Systems

Here at Relogix, we often talk about the importance of understanding the data on employees’ intended behaviour versus their actual behaviours. To give some insight into the power of this kind of data integration, let’s talk a bit more specifically about how this plays out with a commonly used workplace technology: space booking systems.

Space booking systems are often necessary, insightful, and easy to use. But the data they provide is only as reliable as the people who use them---and as it turns out, there’s lots of room for error.

Space booking systems are often necessary, insightful, and easy to use. But the data they provide is only as reliable as the people who use them—and as it turns out, there’s lots of room for error. Without occupancy sensors, space booking systems only show what people intend to do—not their actual behaviour. If we took some time to reflect and be honest with ourselves, we know right down to the individual level that our intentions don’t always turn into reality.

Many employees these days wake up in the morning with choices: where are they going to work? How are they going to work? And with whom? This leaves far too many variables to be able to rely on their stated intentions from when they booked spaces a week ago.

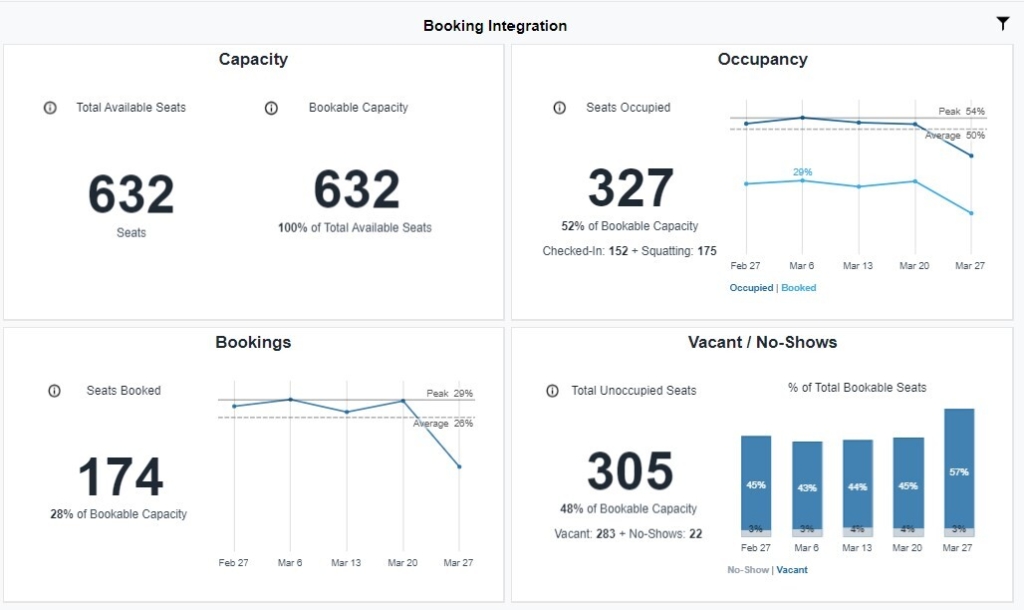
However, combine occupancy sensors with desk booking software using Conexus, and you can capture how people intended to behave—layered with what they actually did. This allows organizations to understand the how people adopt and experience workplace technologies. With regards to space booking, it captures space squatting percentages and no-shows, and identifies opportunities to improve the supply and demand of spaces and the workplace experience.

dashboard of conexus with booking integration data analytics

Automations That Improve The Employee Experience

Another key point where data integration makes all the difference is with automating check-ins. Space booking systems rely on some form of manual user check-in. If this doesn’t happen—say, the employee just forgets—this could result in the space being released for another person to book. With integrated occupancy sensors, we can now automate the check-in only when the space is actually occupied. This seamless use of technology only improves the workplace experience—no more showing up to your booked seat to find it’s already taken.

And, crucial to the Workplace Manager, this same functionality can auto-release the space in the event of a no-show. This avoids the frustrating situation of being unable to book a meeting room or seat when, with just a glance around, we can see that many spaces are actually free. This is just another example of Conexus assisting in the management of the supply and demand of spaces and powering the workplace experience of its users. The days of arriving at a workplace looking for somewhere to sit should never have existed, but they are now certainly a thing of the past.

Where Do We Go From Here?

There is space in the future of the employee experience for the physical workspace, but it must be a destination that people want to go to—there has to be seamless technology and spaces to collaborate, connect and be curious, all with a focus on sustainability. To achieve this, we need data-driven decision making, using trusted answers and genuine insights, all live, ready, and waiting for you when you need them. This is where Conexus fits in to your Workplace Technology stack.

Contact me today to discuss how data integrations within Conexus can facilitate certainty in an uncertain world.

About the Author

Colour headshot image of Simone Fenton-Jarvis, Workplace Consultancy Director, Relogix
Simone Fenton-Jarvis, Workplace Consultancy Director

Simone is a workplace thought-leader who’s passionate about creating human-centric workplaces. She strives to build a world where companies become the vehicle for people and societies to flourish and make the planet a better place. Simone hones in on the employee experience and the impact on organisational performance along with data insights to deliver change and business improvement in culture, space, process, and technology.

The Best Way to Make the Most of Your IWMS Data

Written by Sandra Panara, Director of Workspace Insights

The employee behaviors that informed and shaped the workplaces of yesterday are evolving. Why people go to the office continues to be in flux as we learn to adapt and live with the new consequences of being in the workplace together. How much time we spend at the office, what we do there, and what spaces we need to be productive is a moving target and will continue to be, for some time.

And since employee behavior is what should ideally shape the workplace itself, this makes workplace planning extra challenging. Organizations need some reliable way to understand what’s changing, and whether those changes are temporary or here to stay. To do this, we need reliable data that shows us the nuances of what’s happening in the workplace.

The need for this data is at an all-time high right now. Important decisions need to be made—like how much space do we need, how do we go about occupancy planning, what needs to change in our workplace design and how do we support employees working at the office. Pre-pandemic data collection often referenced a static moment in time. Today, with constantly changing protocols impacting employee behaviors, timely access to data is key.

Expected Behaviours and Workplace Design

Workplace design is integral to the smooth functioning of an organization quote image

Workplace design is integral to the smooth functioning of an organization. As such, the goal to “get it right” from the start means having access to current, relevant, and telling data, to guide and inform.

To design a workspace, planners and designers need to understand how people use and interact with the spaces available in the office.  Static data from sources like surveys, utilization studies, workshops, or interviews with employees, as well as calendar data and desk and room reservation data are often referenced for insights.   However, the insights are limited and mostly about user intent, preferences, and overall satisfaction.

All this data is collected, analyzed, and then transformed into a workplace program that becomes the workplace design plan, which goes on to inform the requirements for construction, furniture and fixturing. Once there’s a design, the workplace program becomes the workplace standard that is input into an IWMS tool—the system of record for the design and functionality of a workplace and its workspaces.

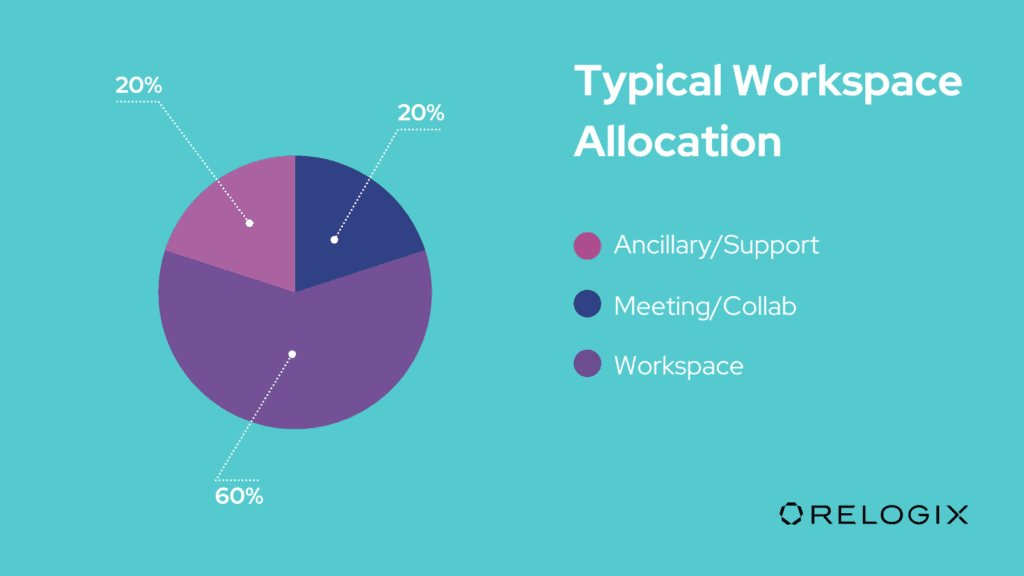
Therefore, when we look at data that comes from an IWMS module, we can baseline the current design intent. The current space allocation, sharing ratios, space types, and sizes tell us how we planned for employees to use the spaces provisioned. For example, an organization might be able to pull the following information out of their IWMS module, which shows that they expected people would work individually 60% of the time, in ancillary spaces 20% of the time, and in collaboration 20% of the time.

Typical workspace allocation pie chart graph image

Specific data points can also highlight what mattered most to the company at the time the design was approved. For example:

  • If a high percentage of space is allocated to meeting rooms, it means that in-person collaboration is highly valued
  • If there are more people than seats, it means that some level of remote work was already occurring and/or was expected
  • If there is mostly open space, it means the organization supports open collaboration. If the spaces are mostly closed off, it indicates more structure and hierarchy

You can tell a lot about what the organization values by just looking at IWMS data and how much and what types of spaces are allocated. It’s worth noting too that IWMS only changes if there’s a change to the physical space or there is a re-organization and/or a space re-allocation. On its own, IWMS data is not enough to support planning and design changes. The usefulness of IWMS data is greatly enhanced when it is combined with the right source of actual space use data that originates from space-level sensors.

When Behavior Data Guides Change

How do we actually keep up with evolving employee needs? How do organizations determine what needs to be changed in a space?

The key is combining static IWMS data with real-time data. By blending these two data sets, we can stay ahead of the evolving workplace changes continuously so that we can be more proactive in our planning and design efforts.

Static data alone simply isn’t enough—knowing all about seat allocation at the time the design was made can show us what the designers intended for the space, using data from a specific moment in time, which may no longer apply to support the changing use of that same space. Without sensors, you can’t see what space types are being used or how they’re being used, which usually differs from what was planned—people are going to improvise to suit their needs.

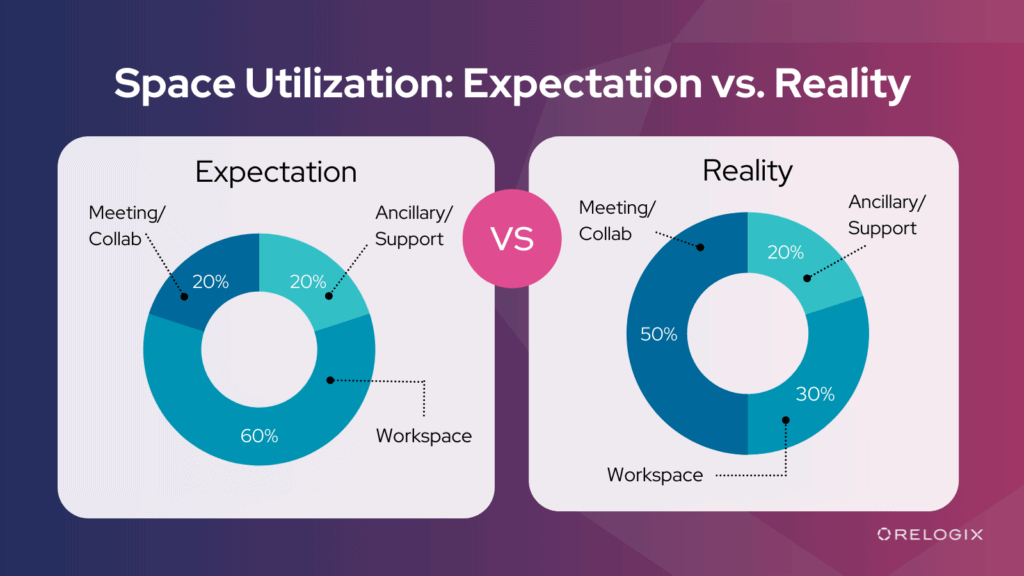
Space-level sensors track metrics like occupancy, utilization, dwell time, and churn, which tell you about the actual use of each individual space. When you look at this usage data in aggregate, you can compare it to what was planned, and determine where changes need to be made. Comparing intended behavior with actual behavior removes the assumptions made at the design stage that were based only on manual data sources.

Combining these two data types, an organization might see that in reality, their spaces are being used differently than was anticipated.

Space utilization: Expectation vs reality comparison chart image

As another example, IWMS might indicate a person-to-seat ratio of 1:1 for Finance, and 2:1 for Sales. Through collecting sensor data based on actual behaviors, we might be able to see that the required ratios are 1:5 for Finance and 3:1 for Sales.  What appears to be a slight change in sharing ratio can have a significant impact on the total seats and overall square footage required to support new demand for workspace.

In addition, a particularly useful metric that only sensors can capture is dwell time. Dwell time refers to the total uninterrupted use of a seat—for example, an employee was at their desk from 9AM to 10AM, 10:30 AM to 12:30PM, and then 2PM to 5PM. This shows us the desk churned 2.67 times, a new and much more accurate “go-to” metric for that improves occupancy planning.

If you’re thinking that there isn’t enough data yet because use of space is so low, good data is not as much about volume as it is about quality.  You don’t need a lot of data to identify clues to potential design changes that correlate with new behaviors. Those who venture back into the office will leave a trail of “data crumbs” —it’s minimal data, but still enough to see a picture of what’s changed about how people interact with the space. Even if only 15 or 20% of your workforce is back at the office, you’ll be able to spot where potential changes can be made.

Especially during this return-to-work period and as the pandemic continues on, updating workspaces based on static and dynamic data are an excellent way to improve employees’ experiences at work. Adapting the workspace to changing needs will give stronger feelings of psychological safety, which is just as important to employee satisfaction as actual safety. It’s just one of the barriers to enticing workers back to the office, but a difficult one to surmount without the right type of data.

The workplace and how employees use it isn’t static. It never was. But now, more than ever before, office use is changing and evolving. With so much uncertainty still looming thanks to the new Omicron variant, no one knows what the future holds. That being said, there is no time like the present to learn about how the employees who want to come back to the office are behaving so you can understand their needs. This allows us to inform improved workplace designs to better suit the new and emerging ways of working in your organization. The success of your office is dependent on how well you understand your employees’ actual needs. And to do that well, sensor data that reflects your organization’s new reality is the key.

About the Author

Sandra Panara, Director of Workspace Insights

Sandra has both a deep and wide understanding of Corporate Real Estate and Technology. With over 25 years hands-on experience she is able to apply non-traditional approaches to extract deep learning from the most unsuspecting places in order to drive strategy. She has developed an appreciation for always challenging the status quo to provoke and encourage new ways of thinking that drive continuous improvement and innovation. Sandra believes square pegs can fit into round holes and that the real ‘misfits’ are those environments that fail to adapt. Her expertise ranges broadly from CRE Portfolio Research, Analytics & Insights, Workforce Planning, Space & Occupancy Planning & Workplace Strategy.

Workplace Density: The One Thing You Can’t Miss in your Back-to-Office Plans

Written by Sandra Panara, Director of Workspace Insights

Returning to the office after the pandemic will throw a ton of new challenges at most companies, especially when it comes to managing the use of their office space. Obviously, things will have to change to ensure everyone’s safety and health but managing density in the workplace is a necessity.

Before the pandemic, when growth or an acquisition meant lots of new hires, companies usually increased workplace density. This meant giving each employee less desk space and squeezing in as many people as possible. The main concern here was to save money, and this strategy was only limited by building or fire codes.

If your company chose this route, you might now be having trouble with return-to-office plans. Unsurprisingly, high-density office spaces aren’t looking very attractive to returning employees. After a year of keeping our distance, physical and psychological health are at the top of everyone’s minds.

For many organizations, the idea of retrofitting the workplace can feel overwhelming—the pandemic isn’t over, and we know new strains of the virus are bound to emerge. In some countries, companies have a “duty of care” towards their employees to protect their health, so doing nothing isn’t an option.

The good news: sensor technology can help you reduce density to avoid the immediate need for a complete retrofit. Which approach to take just depends on your organization’s goals and resources.

Controlling and managing density with data-driven software will help leader decide how many people are dependant..quote
Measure Your Workplace Density

Workplace density can be a tricky concept. There’s a mathematical measurement: how many desks are in how much space? But more importantly, density is measured through employees’ perceptions. How small is the desk? How close are the desks to each other? An office can feel pretty bleak when the desks are too far apart. It’s hard to say whether the ‘office buzz’ that once was will be perceived as good or bad by office occupants moving forward and if a lower key office with less buzz and more purposeful use will be the permanent way forward.

The biggest hurdle for returning to the office is making sure employees feel like they’re able to stay safe and healthy at work. If the pandemic had been shorter, bringing people back to the office might have been a whole lot easier. Even with HR teams deciding which jobs could be done from home, it will be tough to convince employees that are expected to return that their jobs must be done in the office. As the pandemic stretched on, people adapted to getting their work done from home. They also got used to their new habits and routines, like avoiding public transit, no long commutes, and conducting much of their interactions with colleagues, customers, vendors, and partners, online. Safety in the office is about minimizing density, and making sure each person perceives available spaces as safe.

Controlling and managing density with data-driven software will help leaders decide how many people are dependent on physical space, and compare and validate actual behaviours against a solid return-to-office plan.

List of 4 steps to control your density image, Relogix
Control Your Density

To control density, there are a few easy steps you can take:

  1. Accommodate preferences. Continue to support and encourage employees to work outside the office, if they can and want to, all while ramping up return-to-office plans.
  2. Limit occupancy. Limit the number of desk seats available per floor and/or how many people are allowed to be inside the building, on a floor, or in a space at one time. Use technology to do this effectively—take a look at desk booking solutions and health check surveys. Both can give you insight into employees’ intentions and preferences.
  3. Restrict use of space. Remove desks and seats, or otherwise make some spaces unavailable. If you’re using a desk booking tool, spaces can be limited to a set maximum per day. They can also help space employees out, to help with physical distancing.
  4. Repurpose/re-design spaces. Turn cramped cubicles into open, soft seating that makes it easier for people to maintain safe physical distancing.

Setting occupancy limits is easy. Actively managing and maintaining those limits to control office density is not—at least, without the use of sensors. Sensor technology is essential if you want to make sure employees build resilience and feel safe at work. Don’t overlook it!

Managing Your Density

If managing your office density is important to you, you need access to timely data.

To begin to understand how an office space was meant to be used, just look at its design. If you see mostly individual work areas, you can assume it was meant for mostly heads-down work. If there are more meeting and ancillary spaces, the office was meant for more face-to-face interactions to support a collaborative, meeting-centric culture.

Sensor data can help you identify when the actual use of a space is different from its original purpose. As we know, space use guidelines are just suggestions; people end up using space as they see fit. Sensor data allows you to compare design intent with employee intent and hone in on misalignments which can inform the necessary workspace design changes.

If managing your office density is important to you, you need access to timely data image, Relogix
As-It-Happens Data

We’re at a point where the use of office space is continually evolving, which means historical pre-pandemic data isn’t helpful anymore for future planning. For longer-term initiatives, you’ll need “as-it-happens” data—data that shows you how employees are currently interacting with the space to identify what has changed.

For example, before the pandemic, people might have come to the office to work at their desk, the data would have shown a higher demand for desks. Today, people might be coming to the office but the data might show the demand for desk space is significantly lower. Instead there is an increasing demand for meeting spaces, open collaboration spaces, lounges, cafes, and even private spaces like offices. Current data shows you the difference between the original intended use versus actual use and points out clear, actionable insights, even when occupancy levels are below 30%.

Dwell Time

When people do come back to the office, the way they use space is likely to be much different than it was pre-pandemic. “Dwell time”, particularly, is a piece of data that’s becoming more and more important.

Dwell time captures the time someone continuously occupies a space. Knowing dwell time is important because it translates into a proper sharing ratio for each and every seat. Unlike utilization that looks at the average use of space over the number of hours the seat was available, dwell time is much more accurate in determining the total required seats to support demand.

What makes dwell time more meaningful is the idle time between dwells or the “in-between” time: the time that people are away from their desk. Idle time surfaces key insights about availability. For example, a desk that has 15 minutes of idle time between dwells will most likely not be time that can be used by someone else. However, if the idle time is 1 or more hours, it indicates that the desk could be used by someone else who might be looking for a place to sit for a shorter period of time when they are in the office.

In a flexible and hybrid work environment, people are likely to be much more mobile in the office than ever before. Gone are the days of an employee coming in and spending most of their day at their desk. Instead, the office will see more employees who need to meet with colleagues, vendors, partners, clients, etc., which they can’t do at home. The desk might turn into an “in-between” meeting space, which is not at all how most office spaces were originally intended to be used.

Don’t forget that most office spaces are made up of about 30% structured in-person meeting spaces. Coming back, it won’t be as simple as upping the availability of this space based on workplace analytics data. Instead, take the time to observe and learn how people actually interact with the space. Armed with this knowledge, you can be much more strategic about repurposing existing areas to better suit employee needs to ensure an optimal employee experience.

Take time to observe and learn how people actually interact with the space so you can be strategic...quote, Relogix

After such a long hiatus, employees will need time to get reacquainted with the workplace. They’ll need to regain a sense of confidence in going back to the office, so it’s essential that return-to-office policies put the health and well-being of every employee above all else. To win that confidence, companies will have to prove that they’re well aware of the changes that employees need, and show that they’re prepared to put them in place. This goes way beyond acrylic screens, hazard tape, and signage.

Still uncertain about where to begin with your return-to-office plans, or how to interpret the data you have to support your planning? Let our data and insight experts at Relogix show you the way.

About the Author

Image of a lady in a dark blue shirt with blonde hair
Sandra Panara, Director of Workspace Insights

Sandra is known for her deep understanding of Corporate Real Estate and Technology. With over 25 years hands-on experience in North America and the UK with RBC, Purolator, The Coca Cola Company and more. Sandra applies non-traditional approaches to extract deep learning from the most unsuspecting places in order to drive strategy. She has developed an appreciation for always challenging the status quo to provoke and encourage new ways of thinking that drive continuous improvement and innovation. Sandra believes square pegs can fit into round holes and that the real ‘misfits’ are environments that fail to adapt. Her expertise ranges broadly from CRE Portfolio analysis & Insights, Workforce Planning, Strategy Development to Space & Occupancy Planning.

Employee Movement Score – The New NPS for Talent Attraction?

Written by Sandra Panara, Director of Workspace Insights

Originally posted on WELL Learning Library.

What comes to mind when you think of wellness at work? An on-site gym facility? healthy snacks? Sit-stand desks? Wellness related subsidies, benefits or perks to help pay for programs to lose weight or quit smoking, or to pay for equipment like a treadmill? These are just some examples of what might be provided to employees by their employer to encourage healthy living and well-being. While mainstream ideas of wellness at work revolve around offerings like this, another key factor for ensuring wellness at work is specifically related to the on-premises experience, which aims to measure building health.

If you’re in Corporate Real Estate or in Human Resources, you’re likely aware of the WELL Certification – a performance-based system for measuring, certifying, and monitoring features of the built environment that impact human health and well-being, through air, water, nourishment, light, fitness, comfort, and mind. The underlying premise of WELL is simply the understanding that unhealthy buildings can make people unhealthy.

While WELL is focused on making buildings healthy by bringing awareness to how they stack against WELL standards, they also reward organizations who provide options to employees to support movement. The WELL Movement concept promotes movement, physical activity and active living and discourages sedentary behaviors through environmental design strategies, programs and policies. But, while there are several opportunities to accumulate points towards WELL Certification in the Movement category, much of the opportunities are based on employer offerings such as providing amenities, equipment such as adjustable furniture like sit-stand desks or benefits/perks. Regardless, their success in driving and improving wellness depends entirely on an employees’ willingness to use the amenities, equipment and benefits/perks that are offered. This comprehensive list of Employee Benefits and Perks Statistics indicates that only 28% of employees are very confident they’re fully using their benefits confirming that the effectiveness of such programs resides with the employee.

The Gamification of Wellness

What if companies could compete for the healthiest workforce by reporting on aggregate movement metrics for their entire company. What if they could gamify their movement metrics by competing internally i.e., by team/department and also do so externally with companies in similar verticals?

A new KPI for companies who want to up their game in talent attraction and retention by promoting their movement score is emerging. Think of it as the new NPS-like score that is aimed at driving talent attraction rather than retention as their new competitive advantage.


For example, a future hire might be considering working for Bank A vs. Bank B. The future hire is a moderately active person but recognizes they do not want to work in a highly sedentary environment. By observing the movement score across different banks, they are empowered with the information they need to align themselves with a better suited opportunity that aligns with their overall values and goals, which can now also include health and wellness.

While not everyone will have a wearable device like a Fitbit or Apple Watch (nor will people who do, willingly want to share their personal information), companies could instead use sensors to aggregate already anonymous data captured for other CRE related purposes, to demonstrate where health and well-being ranks in their culture, based on a standardized metric like movement. A movement score like this one tells a story. It reveals how well employee flexibility and movement is supported.

Using Sensors for the Win

IoT sensors have been proliferating the tenant office space to help companies manage return to office protocols like restricted occupancy, social distancing and safe seats. Prior to the pandemic, occupancy sensors, people counters etc. were often installed in offices, with the sole purpose of capturing occupancy and utilization to inform seat demand, reducing and optimizing costly wasted workspace and more importantly, to inform workplace design.

Relogix sensors are unique in that they capture typical occupancy, utilization data but they also are able to capture dwell and churn data which are foundational for any portfolio, building, or floor level occupancy planning exercises, offering a level of accuracy that can’t be replicated with manual clipboard type studies which are often undertaken. The accuracy of information at the most granular level ensures the ability to aggregate the data up to suit the specific need. It also translates into proper efficiency sharing ratios that successfully optimize space when implemented, often yielding a reduction or recalibration of the square foot requirements committed to in a lease.


Dwell-time is a game changer. Relogix sensors which are heat and motion activated, can detect and validate presence at a seat anonymously, every 30 seconds, providing as close to a “real-time” snapshot of workspace occupancy and utilization. Where utilization observes the use of a space over time, standard utilization metrics do not reflect continuous use, but dwell time does. For example, in an 8-hour day, a seat may indicate it was 50% utilized reflecting a total of 4 hours of use. However, the 4 hours of use are not necessarily continuous hours (dwell).

Continuous dwell metrics validate whether those 4 hours were continuous, or if not, how many churns occurred. Each “break” between dwell times constitutes a churn. The ability to calculate in aggregate how many employees are sitting continuously for 1, 2 3, 4 hours or more is effectively translated into a highly valuable movement factor that is unique to only your company and driven 100% by the natural movement of your employees, without requesting the employees to share any highly personal information from their own devices.


Define & Measure Your Unique Competitive Advantage

While today, sharing of personal information is not widely acceptable by most employees, with the emerging shift of where work happens, in the future, enabling employees who do care about their total health and well-being to opt-in to sharing such data would benefit employees and employers as they better understand the impact of movement on overall productivity. While individuals might be contributing to the big picture, the individual data is irrelevant as the data is aggregated for the company as a whole, enabling them to correlate movement to other KPIs like attrition and churn and absenteeism, to name a few.

The COVID-19 pandemic has hit companies hard. Businesses and people have been rotating through lockdowns for over a year. When offices re-open, while occupancies might not get back to what they were for a very long time, if ever, we can anticipate that when people come to the office they won’t be doing so to sit at a desk, and if they do, they won’t be sitting for extended periods of time. Using sensors will provide the intelligence to inform your workplace strategy, but more importantly it will provide the insights that take your competitive advantage to a whole new level where the value of the well-being of your employees isn’t just words on a page, but a measurable and meaningful metric that will uniquely set your company apart.

About the Author

Image of a lady in a dark blue shirt with blonde hair
Sandra Panara, Director of Workspace Insights

Sandra is known for her deep understanding of Corporate Real Estate and Technology. With over 25 years hands-on experience in North America and the UK with RBC, Purolator, The Coca Cola Company and more. Sandra applies non-traditional approaches to extract deep learning from the most unsuspecting places in order to drive strategy. She has developed an appreciation for always challenging the status quo to provoke and encourage new ways of thinking that drive continuous improvement and innovation. Sandra believes square pegs can fit into round holes and that the real ‘misfits’ are environments that fail to adapt. Her expertise ranges broadly from CRE Portfolio analysis & Insights, Workforce Planning, Strategy Development to Space & Occupancy Planning.

3 Ways To Use Data Stories To Manage Your Return To Office

Written by Andrew Millar, CEO & Founder

As companies return to the office, how can real estate owners ensure their assets are safe for office occupants?

How can organizations ensure the health and safety of their talent in our new normal?

For many organizations returning to cramped rows of cubicles and open-plan spaces, offices and shared areas will look very different from what they did prior to leaving. With the return to office and subsequent future planning, a focus on health, safety, risk and compliance will be key to successfully managing office spaces in a COVID-19 world.

As we emerge beyond the crisis management phase and enter the return to office phase, we need to develop new processes that require strategic thinking and planning. These new processes – for now and into the future – are being developed without precedent.

How do you develop a plan for something that neither you or your peers have encountered before?

Returning To Work Around The Globe

Cushman and Wakefield’s “Safe Six” protocol compiled thinking and practices of over 53,000 professionals from across the globe. In summary, re-opening workspaces needs to be carefully planned and address key aspects such as the preparation of office buildings and workforces, concrete physical distancing plans, and cleaning of touch points. These will be crucial to employee and building occupant safety.

Companies can mitigate potential risks to employee health and safety through comprehensive planning that begins with a phased transition back to the office and a controlled return to office. There are steps that can be taken to demonstrate action toward mitigating risk.

What Are Data Stories?

Data stories combine workspace data analytics and insights with in-depth, explanatory views to inform your day-to-day activities, reporting and CRE strategy. Data stories help you reveal intelligence and insights across your portfolio to elevate your CRE analytics.

Planning For The Future With Data Stories

Around the world, some offices are sitting half-empty where others have already returned to work. In some cases, these offices were half-empty long before COVID. Before COVID, your data told a story about how your workplace was used and how it could be improved.

Now, these data stories are essential to returning to work. Part of planning for our new normal includes using the right tools and data to inform new practices and protocols for our workplaces. Weaving a data story allows you to:

  • Eliminate guesswork when making strategic decisions
  • Obtain more answers, faster
  • Get insights across lines of business
  • Establish a single source of truth
  • Get standard real estate portfolio metrics
  • See where your portfolio has been, where it is now and where it is going

Data Story #1: The Core Data World

In our current return to office scenario, workspace occupancy and utilization data supports health and safety efforts, particularly on floors with high occupancy, in real time. This data, collected through sensor infrastructure, allows for fast action and communication to ensure people are maintaining proper distancing on individual floors and throughout buildings.

In addition, with future phases, the data gathered can contribute to the development of portfolio rationalization strategies that best align with the behaviors that will become our new normal.

Workspace occupancy and utilization data collected through sensor infrastructure includes:

  • Floor level occupancy
  • Room level occupancy
  • Seat level occupancy (e.g. desks, offices that are either shared or assigned)
Close up of Conexus Insight analytics of occupancy, desks required, desk surplus, and sharing ratio
Data Story #2: The Clustering Problem

How do you ensure proper physical distancing protocols are complied with? You can effectively monitor workspaces to see where people are clustering by using spacing and density management technology.

Employees that are too close together will put their health and the health of the organization at risk. This technology helps companies ensure spaces are used according to new physical distancing protocols. The data captured also demonstrates that your organization took every precaution to protect all office occupants, should it ever be required to do so.

Image example of work spaces that are too close together
An example of Relogix’s spacing and density management technology, from Relogix Dashboard

Data Story #3: Safe Seats

How will employees know where they can sit, without having to worry about when the space was last occupied? While it’s not certain how long COVID-19 survives on surfaces, data suggests it can persist for a few hours or up to several days.

With this Safe Seats technology, seats are highlighted to show where people were sitting within a set duration of time. The “unoccupied” duration can be changed dynamically so you can immediately see the impact on seat availability in real time, which helps identify problematic areas.

Safe Seat technology is also used to identify seats that were recently used so Facilities Management and cleaning teams can use their time efficiently. Once a seat is cleaned, the seat status is updated and re-established as “safe” and available for occupancy.

Close up of Conexus building floor plan showcasing desks, workstations, and space numbers

Data Stories And You

Workplace analytics tools and the data they gather will be important elements of our new normal. They help ensure health and safety, and mitigate risk for real estate owners and organizations. Finding the right combination of tools will be a crucial element of navigating our new normal, now and into the future.

Watch our free webinar to learn more: How to Manage the Workspace During the COVID Crisis.

How To Use Workspace Analytics To Return To Work With Peace Of Mind

Written by Sandra Panara, Director of Workspace Insights

The sudden and widespread shift to working from home as a response to COVID-19 has disrupted the traditional workplace like never before. Pre-COVID-19 many companies held hard stances, for various reasons, against work from home and flex work, but all of those objections and rationalizations quickly evaporated as organizations were forced to find ways to make it work – or suffer the consequences.

This new normal will inevitably influence the future of workplaces and office spaces in lasting and meaningful ways, and as business leaders we need to start preparing for what the workplace experience will become. Before we can start the conversation about bringing anyone back into the office, we need to take a closer look at the emerging health and safety implications in the workplace, including addressing comfort and security, which are necessary for rebuilding employee confidence in a post-COVID-19 world.

Knowing what data is available and how it can help you align with emerging best practices on how to effectively manage your office space will be key to an effective and informed return to work strategy.

Give Employees Peace of Mind with A Data-Driven Health and Safety Policy

Employees, understandably, will be nervous about returning to work, whether they have assigned or unassigned workspaces. Regardless of industry or location, the onus will be on employers around the world to ensure return to work is conducted safely.

Luckily, many of the metrics traditionally used to measure and evaluate the efficient use of your workspace can also be used here. Observing key metrics like occupancy, space utilization, dwell times, and seat sharing ratios through a health and safety lens, quickly reveals the necessary insights to support responsible return to work plans.

Communication will be key as you develop your plans, policies and new measures for returning to work. Letting your workforce know that you will be using this data to help keep them safe, healthy, and productive is step one. Let them know you will be collecting real-time data to help monitor compliance with safety measures and identify risk, so everyone stays safe and healthy.

Communicate early and often; look at this time as an opportunity to build trust with employees and open a dialogue about how this data will be used moving forward.

Move from Short-Term Needs to Long-Term Strategy

Before you start looking at your workspace data, revisit your work from home and flexible hours policies. Any changes here may dramatically impact how your workspace is used moving forward, and employee expectations have likely changed since you originally drafted those policies. Organizations may meet extreme resistance if they try to fall back to previous, restrictive policies, now that team members have had the opportunity to work from home or have been required to work flexibly – even if it wasn’t by choice.

Relogix infographic about the four steps to moving from short-term needs to long-term strategy

Once you have updated your policies on how and when employees are expected to be at the office, you can start looking at how you can better (and safely) use that office space while being mindful of social distancing best practices and the risks of shared surfaces.

Next, consider if your workspace and collaboration seating and desk layouts should change at all. Once you start moving back into the office, leverage data on occupancy, density, and desk utilization in the short-term to actively adjust and manage logistics.

With the recent trends toward open offices and agile workspaces, organizations need to be attentive to keeping density low, adjusting workstation size or availability, and actively prioritizing cleaning routines. Desk utilization data can be used to inform employees where ‘safe seats’ are located and to inform cleaning teams on areas to focus on for disinfection. If you don’t have a cleaning policy or schedule in place to ensure shared or common spaces are disinfected regularly before returning to work, now is the time to implement one. As you return to work, update your schedule and policy as you collect more data and learn more precisely how the space is being used.

While the short-term focus will be dominated by decisions around health, safety, and compliance, the unprecedented move to include work from home as an alternative and acceptable work setting will change the long-term expectations of traditional office workspaces. Data collection on changing behaviours throughout the return to work phase will provide insights to help inform an effective long-term strategy. A shift to include alternative workplaces outside of the office can have significant implications for office space and workspace design requirements.

Prepare for Changes In Office Space Utilization Trends
Relogix quote on focus and returning to work with peace of mind

A successful long-term transition back to work should focus on proactively adjusting office space utilization as you learn more about how employees will use the space going forward.

Flexibility will be key as you go through the next adjustment phase. Allow your organization time to settle into the new normal and to establish new behaviours and routines. The first little while may be a bit chaotic, but we do anticipate many employees will push to work from home at least some of the time and may even push for more flexible work schedules overall.

As expectations around what the office represents to employees shifts, the allocation and defined use of space will need to account for a new normal. Insights and trends that you may have incorporated throughout your workplace strategy before the pandemic may no longer be priorities, or event relevant. This might mean potential changes to seating allocations in the office, for example, which in some instances may lead to significant square foot and cost reductions, which can help to off-set other costs.

Changes to expectations and behaviours mean you need to be prepared for several phases of change before you settle into a long-term workplace design and set up.

Use Data to Manage Workplace Change

Even while reviewing the mechanics of returning to work through a post-pandemic lens, it’s important to remember your long-term organizational needs. You don’t want to have to overhaul your workspace multiple times or have to revisit any new policies that are implemented, so be sure to consider the new normal that will take effect immediately as well as in the future.

Remember that although we’ve seen unprecedented change and upheaval in the last few months, employees are generally pretty resistant to change, and they’ll be looking to assert and regain some control as things return to business as usual. Expect resistance and challenges from your team and use your data to help back up your decisions.

Communicate that data and your reasons for your decisions to provide context, make sure the “why” is clear for every policy, desk, space, and schedule change. An example might be:

“With more employees working from home or on flexible schedules, we now have an average occupancy rate of 42%, meaning only 42% of our desks are being used at any given time. We are leveraging the reduction in desk use to help maintain physical distancing and are using data to manage the 6-foot space between each seating area ask that for training, coaching, and collaborative work you use a boardroom instead of pulling chairs into a single workspace and continue to maintain distance.

Each boardroom has been stocked with hand sanitizer, facial tissue, and disinfectant wipes for your use after touching door handles and before touching shared tables and chairs. Please notify the facility manager if any of these supplies run low.

Additionally, we have observed that the kitchen at peak times (lunchtime) is very busy. With the size of the kitchen, it is impossible to maintain a safe 6-foot distance with that many employees, so we are requesting individuals, teams, and managers proactively shift and stagger their regular lunch times.

If we do not see a decrease in concentration in the kitchen, we may have to consider more strict policies around breaks and lunches. Our ideal goal is no more than eight employees in the kitchen at any one time, which would allow safe physical distancing as needed.”

Your employees will value transparency and candidness in handling their health and safety. By harnessing your workplace data, paired with medically informed best practices, your decisions will have positive outcomes in employee wellness, satisfaction, and security as you navigate the future of work.

Behavioural changes related to when and where employees work will likely mean less daily dependency on office space. The meaning and purpose of the office will be redefined in the next while, and there will also be significant cost savings opportunities driven by the changes we are all about to experience.

As workplace efficiency and optimization strategies pick up momentum, consider the enablers and the inhibitors to employee engagement and productivity, so you can re-invest some of the savings into programs, technology tools, and infrastructure to allow your business and employees to thrive.

To learn more about how you can effectively plan for the return to work, sign up to attend a webinar hosted by Relogix, Ask-Me-Anything: What Will The Workplace Be Like After COVID-19. You can get more details on managing your portfolio during the COVID-19 crisis here.

About the Author

Sandra Panara Colour
Sandra Panara, Director of Workspace Insights

Sandra is known for her deep understanding of Corporate Real Estate and Technology. With over 25 years hands-on experience in North America and the UK with RBC, Purolator, The Coca Cola Company and more. Sandra applies non-traditional approaches to extract deep learning from the most unsuspecting places in order to drive strategy. She has developed an appreciation for always challenging the status quo to provoke and encourage new ways of thinking that drive continuous improvement and innovation. Sandra believes square pegs can fit into round holes and that the real ‘misfits’ are environments that fail to adapt. Her expertise ranges broadly from CRE Portfolio analysis & Insights, Workforce Planning, Strategy Development to Space & Occupancy Planning.

How To Use Big Data To Develop An Effective Workplace Strategy

Written by Sandra Panara, Director of Workspace Insights

When it comes to assessing workspace utilization, there are many approaches that could be taken to generate data for analysis.  Whether the data is generated using employee surveys, observation studies, security badge data or even sensor data, each source of data provides the initial validation necessary to ensure that your workplace strategy is directionally correct.  However, the use of utilization data, although foundational, is only one piece of a very complex puzzle.

The best workspace related insights come from data observed at the lowest level of detail.  Where many equate this to the identity level of the person using space, the reality is the actual identity of the person is irrelevant.  What does matter though is the attributes associated with the person, which is then analyzed in aggregate, to identify unique patterns and trends.

A critical success factor in working with data sources is data sharing between Corporate Real Estate (CRE), HR and IT. In fact, a successful Workplace Strategy cannot be implemented without an in-depth understanding of key data that is owned and/or managed by these three teams in an organization.

This blog will help you understand the different kinds of data sources available, the various challenges that often arise when working with multiple sources, and how to collaborate with other departments to successfully blend that data together.

5 Common Types Of Data Sources

First, let’s review the five main buckets of data often used to develop a proper Workplace Strategy:

#1: Existing Data Sources To Support Physical Workspace Assessment

This type of data includes Integrated Workplace Management Systems (IWMS), seating plans, floor plans, workplace standards and guidelines, leasing data and lease abstract information, owned-location information, financial data, and real estate-related capital projects/spend.
Also, workplace survey data, executive visioning session outcomes, employee focus groups, workplace observation study data, are additional data sources most often captured at the onset of a workplace strategy initiative.

This data type is managed by the Finance and/or Corporate Real Estate function in your organization.

#2: Complementary Existing Data Sources That Are Re-Purposed To Further Support An Assessment Of The Physical Workspace

These data sources most often include security badge swipe data and/or Wi-Fi data, and is typically managed by the Security and/or IT function in your organization.

#3: Complementary Existing Data Sources About The People Who Use The Space

These sources provide information about employee-related attributes such as headcount and headcount forecasts, status (active or on-leave), type (full-time, part-time, contract, seasonal), job title/function, business area/division, age group, tenure group, reporting hierarchy, assigned building location, commuting distance, times and commute methods.

This data typically managed by the Human Resources function in your organization.

#4: External Data Collection Initiatives To Complement A Physical Workspace Assessment

Such initiatives may include people counters or collecting data from varying sensor types, to provide insights about specified locations in your building like a meeting room, workstation, private office, lunchroom or lounge.

This type of data is acquired through a sensor-as-a-service provider such as Relogix. When installed, sensors capture data in real-time and record occupancy, utilization and dwell time. The end result is a clear understanding of the amount of time that various workspaces and rooms in the building are occupied and in use.

#5: External, Publicly Available Data To Enable Additional Insights And Segmentation

This kind of data is publicly accessible and can help support current and future location decisions. It may include collaboration patterns (facilitated by IT) to illustrate adjacency requirements more accurately. Another option may be census (facilitated by HR) or market-related data (facilitated by CRE), which can provide indicators related to viability of growth in existing markets; or present opportunities by illustrating trends related to the labor market, market rent and other data.

Purpose Of Individual Data Sets

Each data set on its own serves a very specific purpose in your organization. For example:

  • Your leasing team might use leasing data to manage rent payments or lease renewals, or to provide the required notice of intent to vacate for leases they don’t plan to renew.
  • Your security team might use security badge swipe data to ensure authorized employees access authorized buildings and spaces within those buildings for security audit purposes. They may also be looking for odd, potentially fraudulent behaviors, like duplicate badge ID numbers assigned to different users who might be accessing separate locations in different parts of the country on the same day.
  • Your HR team might use data about its employees to perform workforce planning strategies. They may be performing people analytics; observing trends and patterns related to the make-up of the organization such as gender, age, and tenure, education level, skills or compensation; or might be using the data to identify gaps so they can adjust their hiring strategies to better plan for the future.

Your CRE team may already be accessing some of this data, like the security badge swipe data, to illustrate building and/or floor occupancy, as well as information from HR like business area for example, which enables grouping of the data to to provide a bit of context about who those users might be.

Blending Data Sources To Reveal Amazing Insights

Being able to blend multiple data sources effectively provides instant value by providing the necessary level of detail which significantly improves the context to your analysis.

Rather than just reporting the percentage of time employees in a particular business unit are in a building or on a floor, or even at their desk, with blended data you could then answer questions like:

  • Does employee age or tenure impact space utilization?
  • Does utilization vary by job function/title or even job level?
  • Is there an existing or emerging preference related to spaces used by varying demographics?

You might also be able to associate other pieces of information about your employees that enable you to perform commuting patterns, which would further allow you to answer questions like:

  • Do employees who live closer to the office utilize space more or less than those who live further away?
  • Do employees access office locations closer to their home rather than the location to which they are assigned and if they do, how often?

Observing data at the appropriate level of detail allows you to validate the many theories you may have read about in published research papers or studies.

That said, it is always more effective to plan space based on the reality of your organization because your planning efforts are tailored to be culturally relevant to your business.

For example, a summary statement in your analysis might initially look something like:

Building ABC located in New York City has an assigned population of 5,000 employees. It’s occupied on average 65% of the time (~ 3,250 employees). 

When augmented with complementary information the statement above will start to look something like the following:

15% of those with presence detected at Building X are Boomers, 40% are Gen X, 35% are Millennials, and 10% are Gen Z. On average, Boomers and Gen X combined come to the office just as frequently as Millennials and Gen Z.  Gen X and Gen Z live within 20 Km of the office. However, Gen Z comes to the office 90% of the time.  100% of Gen Z have been with the company less than 1 year. In all instances, employees who have been with the company for less than two years come to the office 80% of the time vs. other groups who come to the office significantly less frequently.

As you can see, when a few, many or all data sources about both your workspace and your people are successfully combined, amazing insights begin to emerge. This enables you to:

  • Qualify and quantify Real Estate, HR, IT and Finance-related opportunities
  • Develop informed strategies
  • Demonstrate the potential impact a transformation can have in your organization

However, data blending is not an easy feat. Despite all the amazing insights you can garner from using multiple data sources, bringing them all together will elevate several issues.

Challenge #1: Working With Different Formats 

Not only are you trying to blend disparate data points: you also must consider the formats in which they are available (e.g., Excel, text, PDF, PowerPoint, CSV, JSON, and many more).

In most organizations, the first attempt at data blending is usually tackled using Excel. Key data is lifted from non-tabular data sources and put into a tabular format so that the data becomes usable.

Challenge #2: Dealing With Different Levels Of Detail

One of the first challenges you will likely encounter as the data begins to come together, is the inconsistent levels of detail that each data set contains—creating gaps in data.

For example, consider trying to assess workspace utilization with the following three data sets:

  • Your security badge data may be provided at the individual level, or it may be provided at the building level.
  • Your leasing data may be at the building level and the floor level (and there may be different lease expiry dates for different floors in one building).
  • Your employee data may be shared at the building level only, so you may not be able to know precisely the makeup of each floor.

While challenging, blending data with different levels of detail can be achieved and meaningful insights can still be extracted to yield the best possible outcomes. However, this requires a vision and careful planning once you know what data you can use. Understanding this is a critical first step, since it identifies how deep your analysis can go.

Challenge #3: Overcoming Data Privacy And Security Concerns

In order to work with all the data you intend to bring together, you will need to speak with your IT and/or security team.

If you are storing or sharing the data electronically or on the cloud, IT will most definitely need to be involved to assess any risks to the business related to the data. This will likely involve intense scrutiny by IT, not to mention HR, who will have concerns related to the potential risks associated with data security and privacy. While necessary, any data security concerns raised may stall your project before it even begins.

Some organizations have a Privacy and Security by Design process in place, which is a good practice for any organization.

Challenge #4: Respecting Employees’ Rights To Privacy

Data collection in the workplace is not new, but it is evolving. Depending on your corporate culture, employees may react negatively to knowing that they are being tracked or monitored—and may even express feeling like “Big Brother is watching.”

Proactively communicating the following details to employees is a vital requirement that often gets overlooked. However, employees should absolutely know:

  • What data is/will be collected
  • Why it’s being collected
  • Who will have access to the data
  • How it will be used

It is also important to emphasize that the significance of the insights extracted from this data is not at the individual level but rather at the organizational level, to enable you to provide the tools and technologies that best support the needs of employees. Certainly, the analysis happens at the most granular level; however, the reporting should not, unless there is a specifically authorized business reason to do so.

Taking Your Data Sources To The Next Level

Now that you understand the basics of the data sources that may be available to you, you may be wondering what to do with this newfound knowledge.

In future blog posts, we will look at the “how-to” of blending data and overcoming all the technological and organizational challenges that often come with it—including how to extract the information you need to build a sound business case for your Workplace Strategy initiative, and which your senior leadership team won’t be able to ignore.

About the Author

Sandra Panara Colour
Sandra Panara, Director of Workspace Insights

Sandra is known for her deep understanding of Corporate Real Estate and Technology. With over 25 years hands-on experience in North America and the UK with RBC, Purolator, The Coca Cola Company and more. Sandra applies non-traditional approaches to extract deep learning from the most unsuspecting places in order to drive strategy. She has developed an appreciation for always challenging the status quo to provoke and encourage new ways of thinking that drive continuous improvement and innovation. Sandra believes square pegs can fit into round holes and that the real ‘misfits’ are environments that fail to adapt. Her expertise ranges broadly from CRE Portfolio analysis & Insights, Workforce Planning, Strategy Development to Space & Occupancy Planning.